Hotel QR Code Scans Driven by F&B Menus, Study Finds
Scanova data across 52 hotel brands reveals dining menus generate the vast majority of QR code scans, outperforming front desk and loyalty touchpoints.
The short answer
Data from 7.4 million hospitality QR code scans reveals that dining menus capture the bulk of guest engagement, outperforming Wi-Fi, checkout, and loyalty codes. The Scanova study highlights the need for hotel operators to focus digital efforts on high-intent touchpoints.
The short version
- Scanova analyzed 7.4 million QR code scans across 52 hotel and resort brands to track lifetime guest engagement [[1]].
- In-room and restaurant dining menus generated more scans than Wi-Fi, loyalty, checkout, or feedback codes combined [[1]].
- 5 percent of QR codes generate between 78 percent and 95 percent of all scan traffic in hospitality and related industries [[1]].
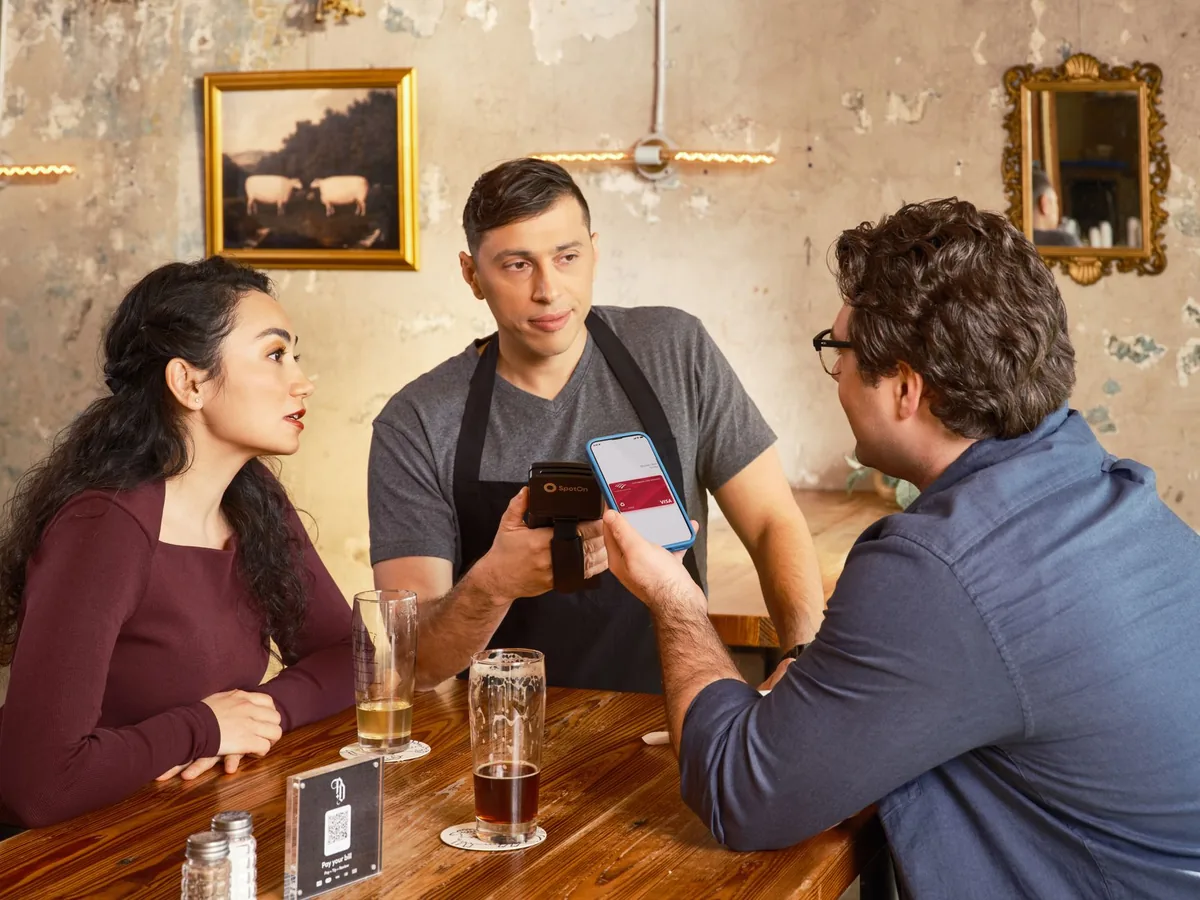
In-room and restaurant dining menus generate more QR code scans than any other hospitality touchpoint, according to first-party event data tracked across 52 hotel and resort brands. While properties place codes across elevator banners, welcome folders, and check-in desks, guest engagement concentrates heavily around recurring food and beverage dining interactions rather than administrative services [1].
What does the Scanova QR code data reveal about hotel guests?
Hospitality QR codes averaged 2,096 lifetime scans apiece, driven upward by a heavily used subset of food and beverage menu codes, Lodging Magazine reported [1]. The study, conducted by tracking platform Scanova, evaluated 7.4 million scans across 52 hotel and resort brands [1]. Rather than relying on marketer surveys or single-year snapshots, the report tracked first-party scan events from the date each code was generated, including codes created more than a decade ago [1].
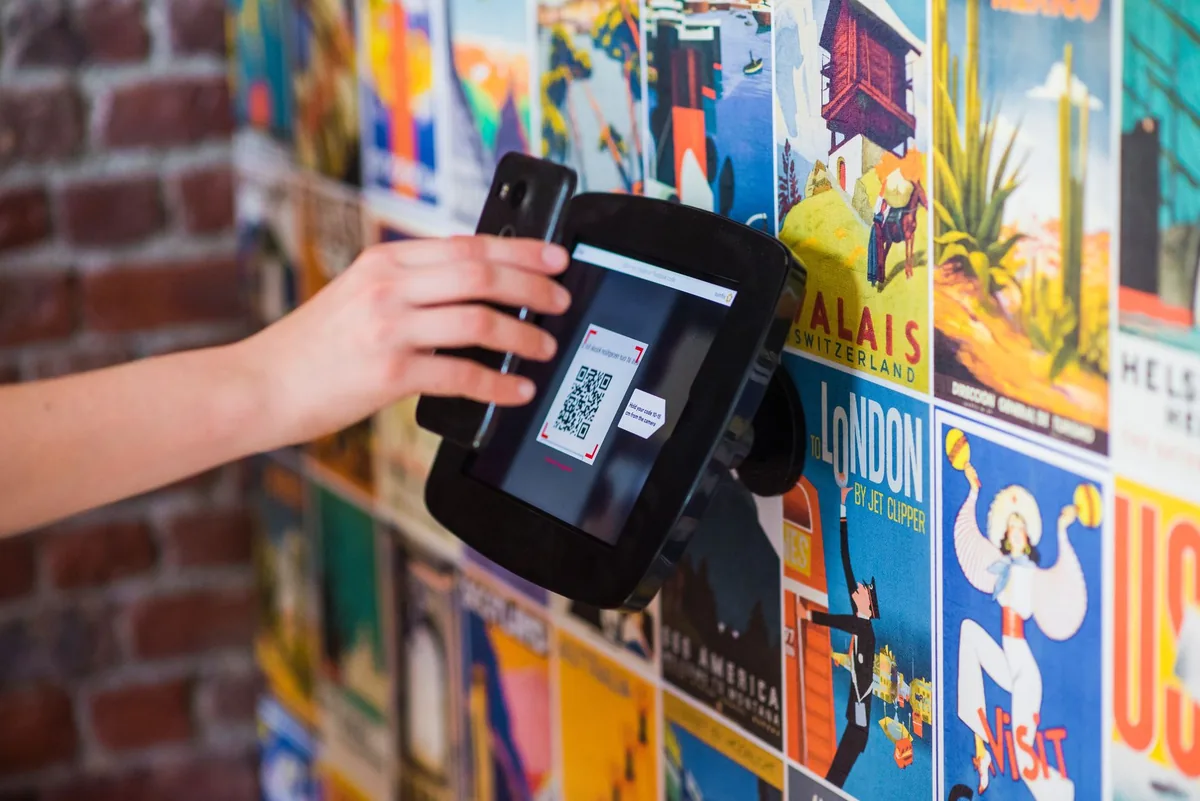
The findings show that guest behavior heavily favors dining use cases over other common placements, as reported by Lodging Magazine [1]. In-room dining and restaurant table menus outperformed alternative touchpoints, including Wi-Fi access portals, loyalty program enrollments, checkout portals, and guest feedback surveys [1].
| Industry Category | Top 5% Code Share of Total Scans | Primary Performance Driver |
|---|---|---|
| Hotels & Resorts | 78% to 95% | In-room and restaurant F&B menus |
| Consumer Packaged Goods | 78% to 95% | Product packaging information |
| Manufacturing | 78% to 95% | Operational and equipment tracking |
| Food & Beverage Manufacturing | 78% to 95% | Ingredient and brand engagement |
Why do F&B menus outperform front desk and Wi-Fi codes?
Menu codes capture outsized engagement because dining represents a high-frequency, high-intent guest behavior, according to Lodging Magazine [1]. When a guest sits down at a restaurant table or looks for room service, they actively seek information, making the code immediately functional [1].
By contrast, secondary placements like front-desk checkout, Wi-Fi onboarding, and loyalty sign-up links underperform because they compete for attention during transactional, low-dwell interactions [1]. A guest checking in or out processes logistics quickly, whereas a diner at a table has time and intent to interact with digital content [1]. Placement visibility also creates differences: eye-level table tents capture scans more reliably than faint door hangers or laminated table stands [1].
How concentrated is QR code usage across hotel portfolios?
Scan volume remains heavily concentrated in a tiny fraction of active codes, matching patterns seen across manufacturing and consumer packaged goods [1]. Across all four industries evaluated by Scanova, the top 5 percent of codes generated between 78 percent and 95 percent of total scan volume within their sector, Lodging Magazine reported [1].
To help multi-property groups evaluate portfolios, the study calculated median scans and median codes at the account level [1]. This structure allows hotel operators to benchmark total portfolio activity rather than evaluating individual codes in isolation [1].
What technical format works best for hotel QR operations?
Dynamic QR codes offer operational advantages over static codes for hotel food and beverage departments that change offerings seasonally, according to Lodging Magazine [1]. Dynamic codes allow operators to redirect destinations and update seasonal promotions or menu items on the backend without reprinting physical collateral, whereas static codes cannot be altered once printed [1].
The study also differentiated between custom-designed codes and plain black-and-white formats [1]. Because properties rapidly deployed digital touchpoints during 2020 and 2021 without subsequent design audits, aligning code architecture with maintenance needs provides long-term operational savings [1].
Reported by
This article was written from the following reporting. Follow the links for the original coverage.
- [1]Study: F&B Menus Drive Bulk of Hotel QR Code Scans— Lodging Magazine
Frequently asked
+Which hotel QR code placements get the most scans?
In-room and restaurant dining menus generate the highest scan volume across hotel properties. They consistently outperform front desk check-in, Wi-Fi access, checkout kiosks, loyalty enrollment, and feedback surveys according to Scanova data [[1]].
+How many scans does an average hotel QR code receive?
Hotel and resort QR codes average 2,096 scans over their lifetime. This average is pulled upward by a small proportion of high-performing codes primarily tied to food and beverage dining touchpoints [[1]].
+What share of QR codes drives the majority of scans?
Across hotels, consumer packaged goods, and manufacturing, the top 5 percent of QR codes account for 78 percent to 95 percent of total scan volume within each respective industry [[1]].
+Why are dynamic QR codes recommended for hotel menus?
Dynamic QR codes allow hospitality teams to update backend digital menu links and seasonal promotions without reprinting physical table tents or collateral, unlike static codes which cannot be changed after creation [[1]].
+Why do front-desk QR codes receive fewer scans than menu codes?
Front-desk codes sit in low-dwell, transactional areas where guests focus on immediate logistics. Menu codes appear when guests are seated and actively looking for information during high-frequency dining moments [[1]].
Keep reading
Our reporting
More in technology