US Hotel RevPAR Climbs 4.4% in 19th Week of Gains
CoStar data shows national hotel RevPAR reached $106.12 in late August as occupancy climbed to 66.7 percent.
The short answer
US hotels recorded a 19th straight week of annual gains with RevPAR rising 4.4% to $106.12 in late August. San Francisco and St. Louis led market growth, while Las Vegas saw notable pullbacks.
The short version
- US RevPAR rose 4.4% to $106.12, completing a 19-week stretch of positive year-over-year comparisons.
- San Francisco led top 25 markets with a 26% RevPAR increase to $165.
- Las Vegas experienced the largest market contraction, with RevPAR falling 20% to $95.15.
US hotel performance metrics sustained upward momentum into late summer, posting a 4.4 percent year-over-year RevPAR increase to $106.12 for the week of August 16–22, alongside an occupancy rate of 66.7 percent and an ADR of $159.11, extending a positive growth streak across the nation according to CoStar data reported by Lodging Magazine [1].
How long has US hotel performance maintained positive annual comparisons?
The hotel industry logged its 19th consecutive week of positive year-over-year comparisons through August 22, according to data from CoStar reported by Lodging Magazine [1]. This weekly performance builds on earlier positive results reported for July, where the industry generated travel momentum across operational metrics, according to CoStar data in Lodging Magazine [2]. Lodging Magazine reported that the late-August surge lifted overall occupancy by 2.1 percent to 66.7 percent compared to the matching week in 2025 [1]. Average daily rate rose 2.3 percent to $159.11, which combined to drive national RevPAR up by 4.4 percent to $106.12 [1].
Which top urban markets posted the strongest RevPAR and occupancy lifts?
San Francisco led all top 25 markets in both occupancy growth and RevPAR expansion during the week ending August 22, Lodging Magazine reported [1]. According to Lodging Magazine, San Francisco posted a 13.2 percent rise in occupancy alongside a 26 percent jump in RevPAR to $165 [1]. St. Louis followed closely with major performance lifts, bolstered by hosting the BMW Championship [1]. The market achieved a 10.5 percent gain in occupancy to 66.8 percent and a 23.1 percent rise in RevPAR to $90.53 [1].
| Market / Metric | Occupancy (Level / YoY Change) | ADR (Level / YoY Change) | RevPAR (Level / YoY Change) |
|---|---|---|---|
| US National Average | 66.7% (+2.1%) | $159.11 (+2.3%) | $106.12 (+4.4%) |
| San Francisco, CA | $79.1 (+13.2%) | N/A | $165 (+26%) |
| St. Louis, MO | 66.8% (+10.5%) | $135.43 (+11.4%) | $90.53 (+23.1%) |
| Las Vegas, NV | 60% (-17.4%) | N/A | $95.15 (-20%) |
| New York City, NY | N/A | $262.63 (-6.8%) | N/A |
What drove rate growth and where did ADR soften?
St. Louis captured the largest ADR lift across major metropolitan areas, climbing 11.4 percent to $135.43 as golf tournament demand elevated pricing power [1]. In contrast, New York City recorded the steepest ADR reduction among the top 25 markets, falling 6.8 percent to $262.63 [1]. Pricing shifts across individual markets played a decisive role in local revenue pacing as summer travel crossed into late August [1].
Which major hotel markets suffered the steepest declines?
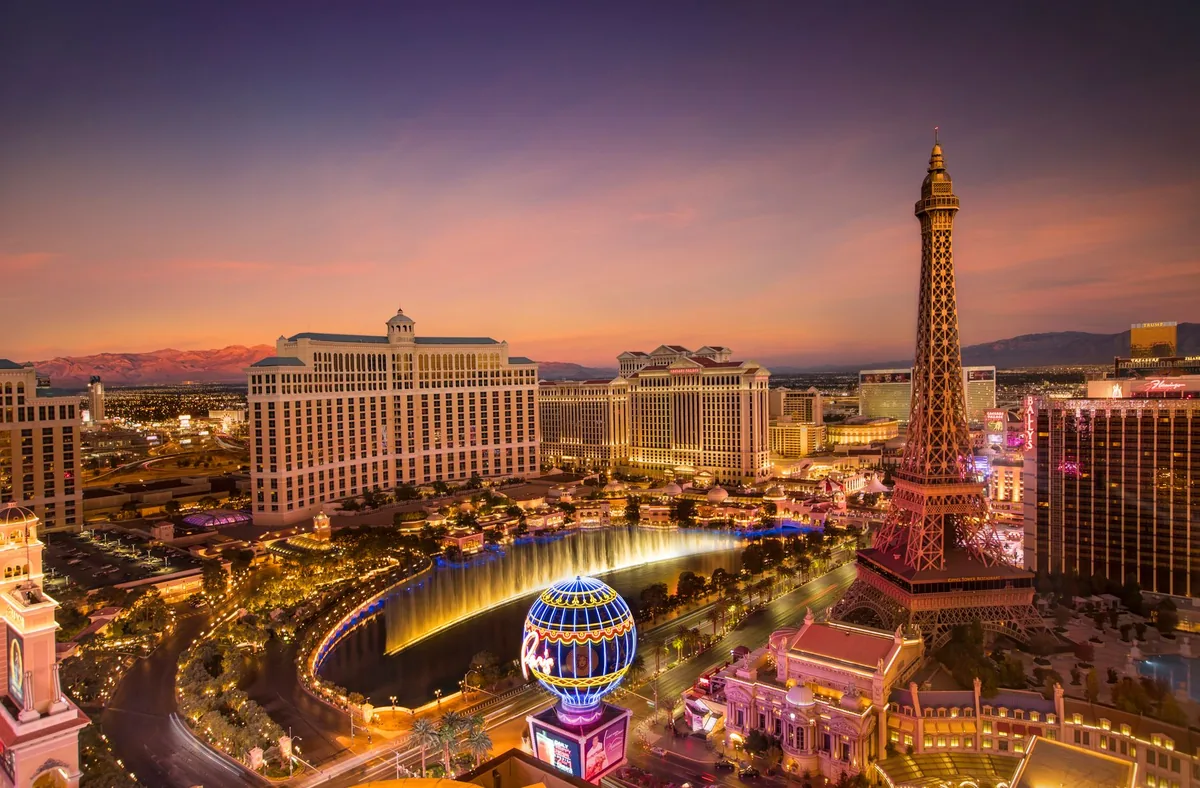
Las Vegas experienced the sharpest pullbacks in operational metrics among the top 25 markets during the late-August tracking period, according to CoStar data published in Lodging Magazine [1]. Occupancy in Las Vegas fell 17.4 percent to 60 percent, while RevPAR contracted 20 percent to $95.15 [1]. While national averages maintained positive trends through July and August, market-level results showed distinct variations depending on local event calendars and destination demand [[1], [2]].
Reported by
This article was written from the following reporting. Follow the links for the original coverage.
- [1]US Hotel RevPAR Climbs 4.4% in 19th Week of Growth— Lodging Magazine
- [2]CoStar Data Shows Strong US Hotel Gains in July— Lodging Magazine
Frequently asked
+What was the national US hotel RevPAR for the week of August 16–22?
National RevPAR reached $106.12 for the week of August 16–22, reflecting a 4.4 percent increase compared to the matching week in 2025 according to CoStar data.
+How long has the US hotel industry maintained year-over-year performance growth?
The industry marked its 19th consecutive week of positive year-over-year performance comparisons through the week ending August 22, following earlier gains recorded throughout July.
+Which top market saw the highest RevPAR increase in late August?
San Francisco recorded the highest RevPAR growth among the top 25 markets, rising 26 percent to $165 alongside a 13.2 percent increase in occupancy.
+What impact did the BMW Championship have on St. Louis hotels?
Hosting the BMW Championship drove St. Louis to the largest ADR increase among major markets, rising 11.4 percent to $135.43, with RevPAR climbing 23.1 percent to $90.53.
+Which major hotel markets posted declines in late August?
Las Vegas recorded the steepest declines with occupancy falling 17.4 percent to 60 percent and RevPAR dropping 20 percent to $95.15, while New York City logged the largest ADR drop at 6.8 percent.
Keep reading
Our reporting
More in finance